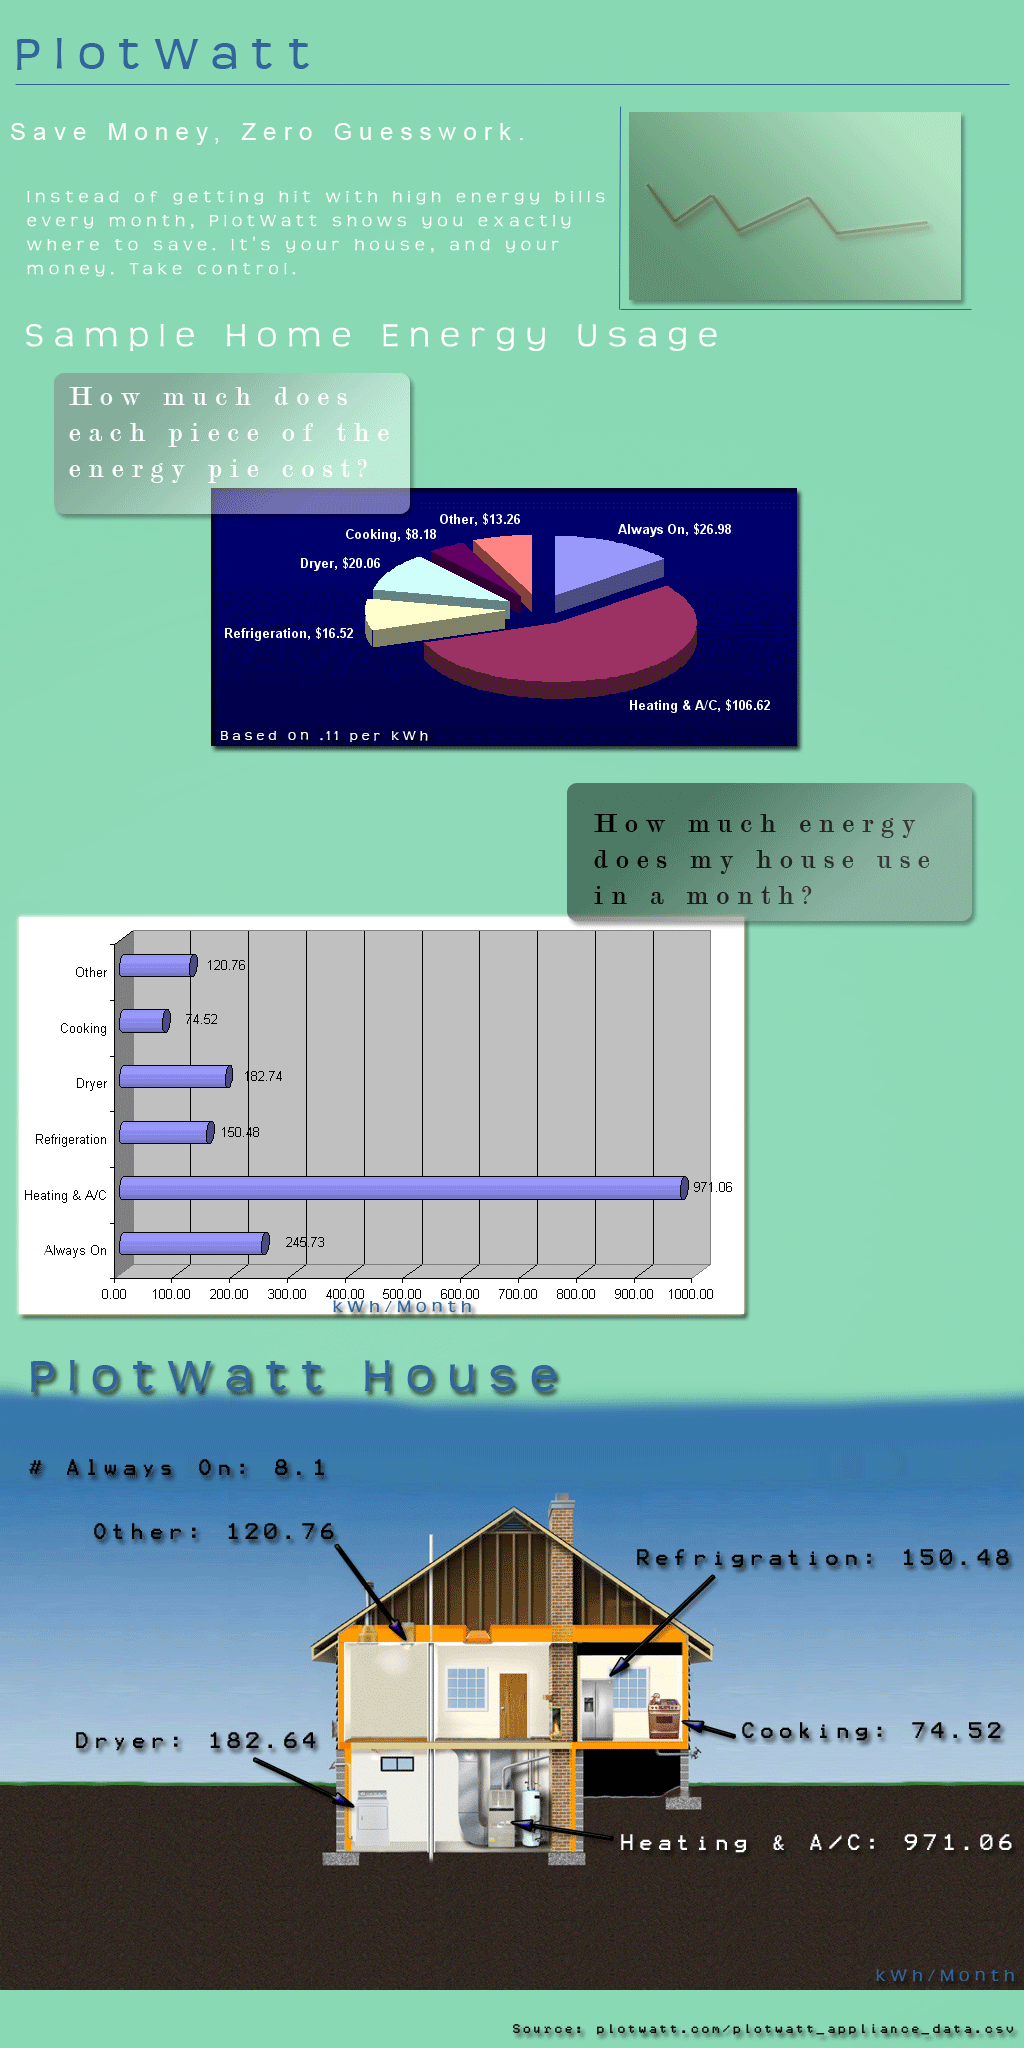
PlotWatt Info-Graphic
In lieu of a cover letter the info-graphic below describes data from a typical PlotWatt home. The information described in this infographic represents the electrical usage in kWh and cost for 6.47 month period between the dates starting with September 1, 2009 and ending with March 21, 2010. Data is obtained from the file at plotwatt.com/pl